I was rechecking one of the few shared counters that remained in a small cross-platform runtime after queues and allocator state had already been partitioned. To make the synchronization cost visible, 64 worker threads incremented the same 64-bit word as fast as they could.
On a Zen 4 server, a relaxed atomic fetch-add took 6.70 nanoseconds per completed increment. Putting the same increment behind a small test-and-test-and-set lock that eventually calls nanosleep reduced that to 2.52 nanoseconds, or about 2.7 times as many completed increments per second.
The sleeping lock kept the same lead on the Intel and Zen 5 servers. On an Arm Neoverse V2 server, however, the order reversed: fetch-add took 8.33 nanoseconds and the lock took 9.08.
I tested nine contenders, ranging from direct atomics and deliberately naive locks to backoff designs and platform mutexes. Some provide a useful bad baseline. I shipped a bounded-backoff version of the read-before-exchange lock in Astral after these results showed how expensive its old event lock had become.
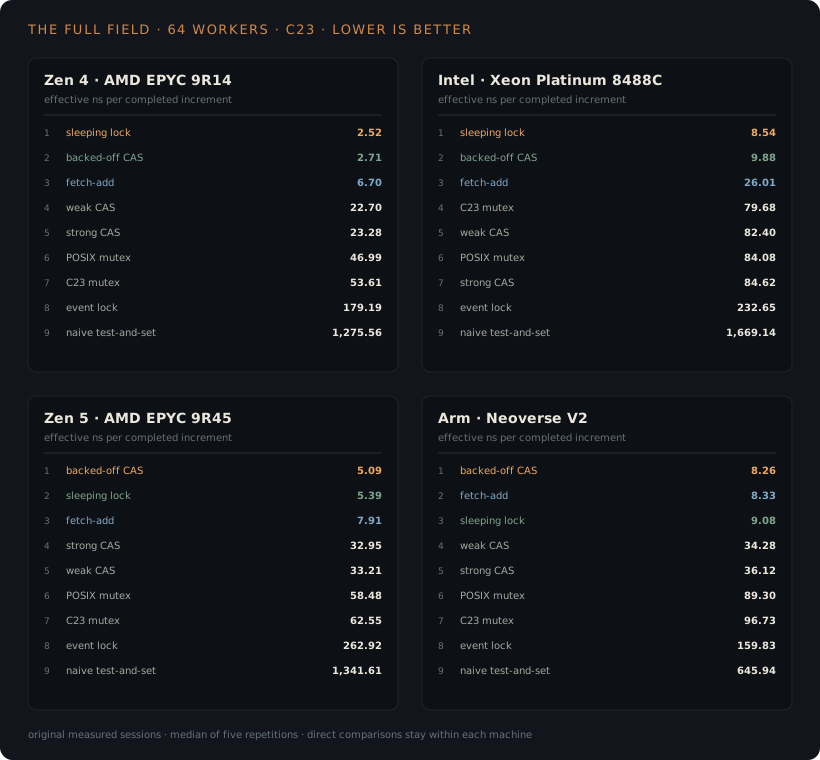
The winning implementations all keep a crowd of callers out of the immediate retry loop, but they do it at different points. Fetch-add completes the update without a software retry branch. Backed-off CAS puts a losing caller to sleep before it tries the newer value, while the sleeping lock stops most waiters before they attempt another exchange on the lock word.
I normally design shared words out of hot code. A queue can partition state by slot, while an allocator can reserve chunks and let each thread advance a private cursor. The counters that survive that work usually coordinate a sequence, phase, reference count, or handoff between threads.
For those remaining counters, I needed to know when a direct atomic was enough, when retry backoff mattered, and when a losing waiter should stop running. I followed the implementations from source into the emitted instructions, measured them on four server processors, and then put useful work around the shared update. Several early results looked convincing until I inspected what the machines had actually executed.
The exact test
Every worker performs the same number of increments. The atomic contenders update one aligned counter directly. The lock contenders acquire an aligned lock word, increment a plain counter on another cache line, then release the lock.
The two measured bodies reduce to this:
void run_atomic_worker(shared_state *state, increment_fn increment) {
  for (uint64_t i = 0; i < state->iterations_per_worker; ++i) {
    increment(&state->atomic_counter);
  }
}

void run_locked_worker(
    shared_state *state,
    lock_fn lock,
    lock_fn unlock) {
  for (uint64_t i = 0; i < state->iterations_per_worker; ++i) {
    lock(&state->lock);
    ++state->locked_counter;
    unlock(&state->lock);
  }
}
The metric is elapsed wall time divided by all increments completed by all workers:
completed = iterations_per_worker * workers;
effective_ns_per_increment = elapsed_ns / completed;
It is the reciprocal of aggregate throughput. It is not the latency seen by one thread. With 64 workers making progress in parallel, the effective time can fall below one processor cycle without claiming that an individual instruction completed that quickly.
Every contender finishes with the same count, but they do not provide the same ordering. Relaxed fetch-add only makes the increment atomic, while the locks also order the critical section through acquire and release operations. This benchmark has no additional payload that needs that ordering, so the numbers compare the cost of one correct increment rather than interchangeable APIs for a larger program.
The memory layout is visible in the reduced source. Direct atomic contenders touch one 64-byte-aligned counter. Lock contenders use an aligned lock word and increment a plain counter on another cache line, which gives the lock an extra line but keeps waiters from fighting the owner over the payload line. Combining both values would add false sharing between acquisition and the protected increment.
Each timed interval begins after every worker reaches a barrier. Setup, thread creation, count checks, and file output stay outside it. The main tables report the median of five C23 repetitions calibrated to last at least 50 milliseconds, with the requested Linux affinity mask confirmed for every worker. C++20 and Rust use the same algorithms as separate code-generation checks and are not averaged into the C23 result.
The four headline machines all ran Linux with 64 workers:
| shorthand in the article | processor | architecture | placement |
|---|---|---|---|
| Zen 4 | AMD EPYC 9R14 | x86-64 | 64 explicit logical processors |
| Intel | Intel Xeon Platinum 8488C | x86-64 | 32 cores, two hardware threads per core |
| Zen 5 | AMD EPYC 9R45 | x86-64 | 64 explicit logical processors |
| Neoverse V2 | Arm Neoverse V2 | AArch64 | 64 explicit logical processors |
I compare contenders only within the same machine. Clock policy, memory system, virtualization, and compiler target differ across hosts, so the absolute numbers are not a processor ranking. Each useful comparison changes the synchronization primitive while keeping the host and its execution policy fixed.
The reduced public benchmark body and six custom contenders are available alongside the four-cell GCC and Clang target matrix in Compiler Explorer.
The nine contenders
I chose the field to cover four different questions:
| group | contenders | why they are here |
|---|---|---|
| direct atomics | fetch-add, weak CAS, strong CAS | the obvious operation and the two common software forms |
| contention-aware candidates | backed-off CAS, sleeping test-and-test-and-set, event-wait lock | implementations that deliberately reduce retry traffic |
| naive control | test-and-set | the smallest plausible lock and a useful example of what not to do |
| library baselines | POSIX mutex, C23 mutex | production primitives that may park and must support much broader workloads |
The naive entry establishes how expensive one bad exchange loop can become, so "spinlocks are slow" does not silently expand into a claim about every user-space lock. The two mutexes establish the other end of the comparison: they include parking, ownership, and wake-up behavior that this one-word benchmark does not need.
The atomic group starts with the operation most code would use:
void fetch_add_increment(_Atomic uint64_t *counter) {
  atomic_fetch_add_explicit(counter, 1, memory_order_relaxed);
}
The weak and strong compare-exchange loops perform the same increment in software:
uint64_t current = atomic_load_explicit(counter, memory_order_relaxed);
while (!atomic_compare_exchange_weak_explicit(
counter, ¤t, current + 1,
memory_order_relaxed, memory_order_relaxed)) {
}The strong version changes weak to strong. The backed-off version also uses strong compare-exchange, then calls nanosleep after a failure:
while (!atomic_compare_exchange_strong_explicit(
counter, ¤t, current + 1,
memory_order_relaxed, memory_order_relaxed)) {
nanosleep_one();
}Strong matters in the last loop. A weak compare-exchange may fail spuriously. Turning a spurious failure into a scheduler round trip would be a terrible exchange.
The lock group starts with the control I expected to lose:
while (atomic_exchange_explicit(
    state, 1, memory_order_acquire) != 0) {
}
The naive test-and-set lock exchanges on every check, so even a losing waiter requests write ownership of the lock word.
The sleeping lock is test-and-test-and-set. It reads first and attempts the exchange only when the word looks free. After eight probes it sleeps:
for (;;) {
  for (uint32_t probe = UINT32_C(0); probe < UINT32_C(8); ++probe) {
    if (atomic_load_explicit(state, memory_order_relaxed) == 0 &&
        atomic_exchange_explicit(
            state, 1, memory_order_acquire) == 0) {
      return;
    }
  }
  nanosleep_one();
}
The request hands control to the scheduler and does not promise a one-nanosecond delay.
The lock does not provide fairness. One waiter may sleep through many handoffs, and the aggregate throughput numbers do not report how long that waiter took to acquire the lock.
The event lock assumes that a short core-local wait is cheaper than descheduling a thread. It spins briefly and then uses WFE on Arm, while unlock stores zero and executes SEV. This implementation has no equivalent event instruction on x86, so its wait falls back to pause.
The last two rows use the operating system and standard C library: pthread_mutex_t and C23 mtx_t. They are general-purpose locks with parking paths, ownership rules, and behavior outside this tiny critical section.
All lock-protected counters use the same plain increment. The difference is entirely in acquire, wait, and release.
One worker before sixty-four
I started with one worker because contention can hide basic code-generation mistakes.
On Zen 4, a plain non-atomic increment took 0.287 nanoseconds in the C23 ladder. Relaxed fetch-add took 1.91. Sequentially consistent fetch-add took 1.91 as well. A sequentially consistent compare-exchange took 2.39.
The flat fetch-add result is expected on x86. Relaxed and sequentially consistent read-modify-writes both compile to a locked instruction. The ordering request changes the language guarantee, but it does not give the compiler a cheaper x86 opcode for this operation.
The Intel server showed the same pattern at a different absolute cost:
| single worker, C23 | Zen 4 | Intel Xeon |
|---|---|---|
| plain increment | 0.287 ns | 0.270 ns |
| relaxed fetch-add | 1.910 ns | 4.828 ns |
| sequentially consistent fetch-add | 1.906 ns | 4.827 ns |
| sequentially consistent CAS | 2.385 ns | 8.622 ns |
The ordering ladder has its own x86 Compiler Explorer view and Arm LSE view. On Arm, ordering is visible in the mnemonic. Relaxed fetch-add uses ldadd, acquire uses ldadda, release uses ldaddl, and acquire-release uses ldaddal.
With one worker on Zen 4, fetch-add wins the counter test at 1.98 nanoseconds. The sleeping lock takes 2.17 and backed-off CAS takes 2.44. Add a second worker and fetch-add jumps to 5.29. The lock stays at 2.18.
The full field at sixty-four workers
These are the final C23 medians. Lower is better.
| contender | Zen 4 | Intel Xeon | Zen 5 | Neoverse V2 |
|---|---|---|---|---|
| backed-off CAS | 2.71 ns | 9.88 ns | 5.09 ns | 8.26 ns |
| sleeping lock | 2.52 ns | 8.54 ns | 5.39 ns | 9.08 ns |
| relaxed fetch-add | 6.70 ns | 26.01 ns | 7.91 ns | 8.33 ns |
| weak CAS loop | 22.70 ns | 82.40 ns | 33.21 ns | 34.28 ns |
| strong CAS loop | 23.28 ns | 84.62 ns | 32.95 ns | 36.12 ns |
| POSIX mutex | 46.99 ns | 84.08 ns | 58.48 ns | 89.30 ns |
| C23 mutex | 53.61 ns | 79.68 ns | 62.55 ns | 96.73 ns |
| event lock | 179.19 ns | 232.65 ns | 262.92 ns | 159.83 ns |
| naive test-and-set | 1,275.56 ns | 1,669.14 ns | 1,341.61 ns | 645.94 ns |
The CSV behind this table includes each median, interquartile range, and validity flag.
The naive lock is catastrophic on Intel at 1.67 microseconds per completed increment, compared with 8.54 nanoseconds for the sleeping lock. Both protect the same one-increment critical section. The two-order-of-magnitude gap comes from whether every loser repeatedly requests write ownership or first observes the lock with ordinary loads and eventually stops running.
The plain CAS loops are also poor because every failure leads directly to another read-modify-write. Under contention they create the same kind of traffic as the naive lock, although the successful attempt also completes the counter update. Weak versus strong barely matters in the LSE and x86 rows because both lower to hardware compare-exchange, leaving the failure policy as the much larger variable.
The platform mutexes land in the middle because they support long critical sections, thread descheduling, and ownership rules that this benchmark never exercises. A specialized primitive only has to protect one increment, while the operating-system and C library implementations must remain useful for much broader workloads.
The event lock loses differently on the two architectures. Its x86 pause fallback leaves every waiter runnable and still reading the lock line. Arm can put those waiters into an event state, but each SEV wakes the whole group, so one thread acquires the lock while the rest return to sleep before the next one-increment handoff repeats the broadcast.
The wait policy was the largest variable
The sleeping lock contains two independent choices. It reads the word before attempting an exchange, and it eventually stops running. I separated those choices before treating nanosleep as the explanation.
The first sweep kept the lock and critical section identical, then changed only what a failed waiter did. These are 64-worker C23 medians:
| wait policy after a failed acquisition | Zen 4 | Intel Xeon |
|---|---|---|
request a 1 ns nanosleep |
2.49 ns | 8.41 ns |
| exponential backoff | 34.81 ns | 57.12 ns |
| retry immediately | 207.94 ns | 239.32 ns |
call sched_yield |
285.88 ns | 280.25 ns |
execute pause |
378.62 ns | 245.08 ns |
| event-lock x86 fallback | 373.69 ns | 248.59 ns |
| park through the OS wait path | 432.76 ns | 849.73 ns |
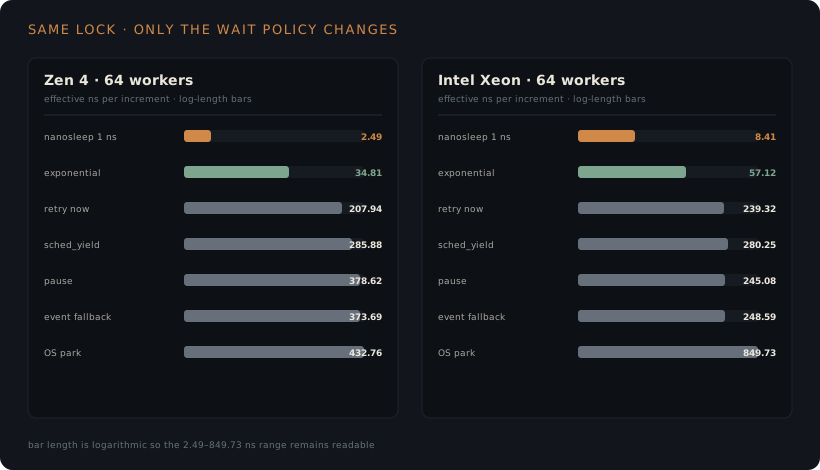
The one-nanosecond request is not a one-nanosecond sleep. It hands the worker to the scheduler and returns much later, which is exactly what helps when the protected work is only one increment. An individual sleeper can wait far longer than the reported 2.49 nanoseconds because that number measures aggregate completions, not one thread's latency. While most waiters are off the run queue, one active thread can acquire, increment, and release without fighting 63 runnable peers.
None of the other wait policies creates the same balance. pause makes a short spin loop friendlier to the processor but leaves the thread runnable, while immediate retry keeps touching the lock and attempts an exchange as soon as it appears free. sched_yield surrenders the current time slice without ensuring a useful sleep, and the full OS parking path removes the waiter at a transition and wake-up cost too large for a one-increment critical section.
Exponential backoff cuts the immediate-retry cost substantially on both machines, but it leaves enough active waiters that the one-nanosecond sleep is still 14 times faster on Zen 4 and nearly seven times faster on Intel.
I also swept the number of read-only probes before sleeping. One, two, four, eight, twelve, sixteen, twenty-four, and thirty-two probes all landed between 2.499 and 2.517 nanoseconds on Zen 4. The complete range was less than 0.8 percent.
Nothing special happened at eight probes. It is one point on a flat part of this machine's curve. The choice that matters is reading before exchanging, then eventually removing a losing waiter from the run queue. A runtime that ships this lock still needs to tune the transition for its actual critical sections and scheduler.
What sharing one cache line costs
The full ranking shows which implementation won. A separate sharing sweep isolates the cost that every contender eventually has to manage.
Sixty-four Zen 4 workers incremented counters in three layouts:
| layout | effective time per increment |
|---|---|
| each worker has a separate cache line | 0.031 ns |
| private counters share cache lines | 0.602 ns |
| every worker updates the same word | 6.737 ns |
The first two rows still report aggregate throughput. They do not claim a single store completed in 0.031 nanoseconds.
In the middle row, every worker owns a different counter, but several counters occupy each cache line. Writes to logically private values therefore invalidate lines used by other cores, making the aggregate work 19 times more expensive through placement alone.
The final row adds a dependency that padding cannot remove because every increment consumes the value produced by the previous one. Serializing that update costs another factor of eleven.
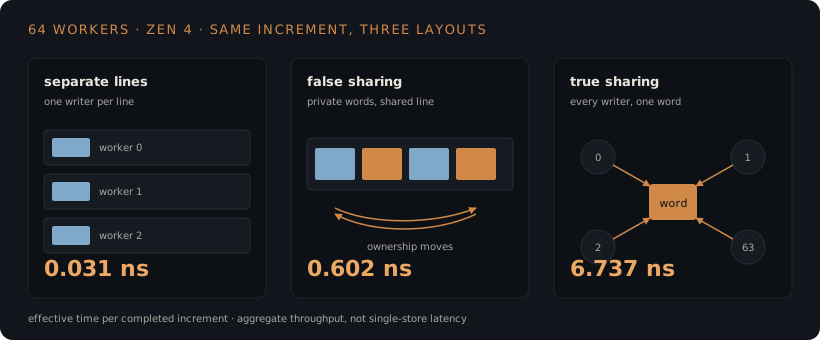
Padding fixes the false sharing in the middle row, but a truly shared read-modify-write still has to be serialized somewhere.
Why the x86 ranking looks this way
On x86, Clang turns the relaxed fetch-add into one instruction:
lock inc qword ptr [rdi]The full reproduction shows the same selection in the measured C23 configuration.
One instruction sounds like the lower bound. Under contention, the arithmetic inside it is not the expensive part. The core must obtain write ownership of the cache line. When another core performed the previous increment, that ownership has to move.
Every fetch-add commits its caller to a write, so all 64 workers continue requesting ownership of the same cache line. The hardware has to serialize those updates, and the operation gives a losing caller no software point where it can stop adding pressure.
The plain compare-exchange loops add a losing path: each worker loads the counter, computes the next value, and executes lock cmpxchg, but only one attempt can succeed. Every loser receives the newer value and immediately executes another locked operation, driving the strong loop to 23.28 nanoseconds on Zen 4 and 84.62 on Intel at 64 workers. The x86 CAS reproduction shows the instruction that every retry executes.
Backed-off CAS keeps the same successful instruction and changes the failure branch. A loser sleeps before trying again. That took Zen 4 from 23.28 down to 2.71 nanoseconds. On Intel it went from 84.62 to 9.88.
The sleeping lock changes the traffic earlier. Waiters probe with ordinary loads, which can observe the locked state without requesting write ownership. After eight probes they call nanosleep. One worker acquires the lock, increments a counter with a normal instruction, and releases the lock with a store.
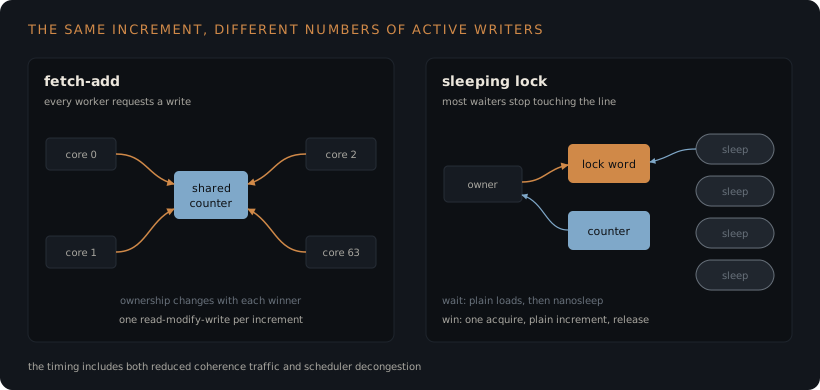
One cache line moving between cores
Modified, Exclusive, Shared, Invalid (MESI) is enough as a working model for this result, even though the measured Intel and AMD processors add states such as Forward or Owned and implement the details differently.
Assume Core A completed the previous increment and holds the counter line in Modified state. When Core B executes lock inc, it cannot keep the update private and make it visible later. Core B first requests exclusive ownership of the line. The coherence fabric obtains the current data from its owner and any response required to give Core B exclusive access. If the line was Shared because other workers had loaded it, their copies would be invalidated and their acknowledgements would have to return. Only then can Core B enter Modified state and perform the read-modify-write.
The next increment may move the same line back to Core A or on to another core. With 64 active writers, the line keeps moving while every update waits for the value produced by the previous update.
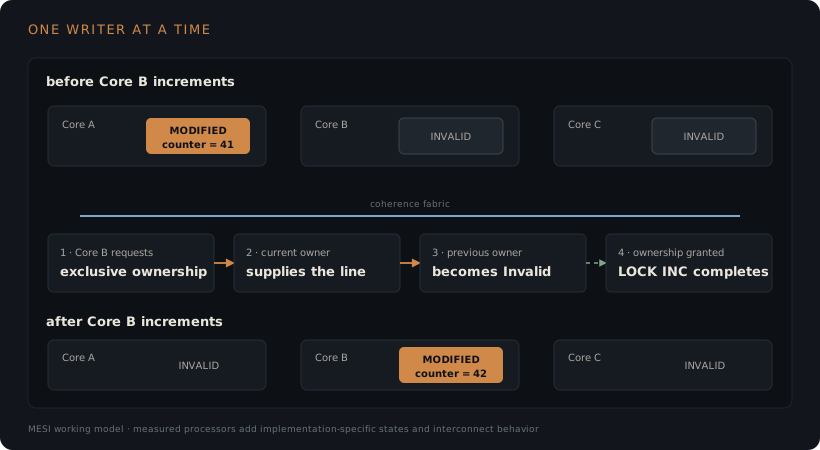
This is also why the naive test-and-set lock is so expensive. Every failed xchg asks for exclusive ownership merely to read back that the lock still contains one. The sleeping lock usually checks the word with ordinary loads, which can use shared cache copies without starting another ownership transfer. It attempts xchg only after observing zero, and after eight failed probes it stops running for a while.
Why the store buffer cannot hide a locked update
An ordinary store does not always wait at retirement for every other core to observe it. The core can place the store in its store buffer, continue executing, and make the store globally visible once the cache line is writable. A later load on the same core can receive the pending value directly through store-to-load forwarding.
That works because the store buffer holds a private update that has not become globally visible yet. A locked read-modify-write cannot use the same freedom. It has to read the current globally ordered value and publish one indivisible replacement before another core performs its own read-modify-write.
Intel documents two details that matter here. A LOCK operation drains older stores, and a failed CMPXCHG still performs a write cycle on its destination. So a failed comparison is not reduced to a shared read. It still participates in the ownership machinery before the software retry loop tries again. Both details are in the Intel Software Developer's Manual.
Draining the store buffer and obtaining ownership are separate operations. The drain orders older local stores before the locked instruction. The coherence transaction gives the core permission to modify the contended line. A core can finish draining its stores and still wait for another core to supply that line.
The sleeping lock uses the store buffer differently. Once a worker acquires the lock, the payload increment and unlock are ordinary stores. They can enter the store buffer in program order. Another core cannot successfully acquire the lock until the unlock store becomes visible, and x86 store ordering makes the earlier payload update visible first.
That changes how I read the x86 loops:
| contender | operation on the contended line | what a loser does | relevant x86 cost |
|---|---|---|---|
| fetch-add | lock inc |
there is no software loser | every increment is a locked operation |
| weak or strong CAS | lock cmpxchg |
retries immediately | failed attempts still perform a locked write cycle |
| backed-off CAS | lock cmpxchg |
sleeps after failure | fewer failed locked operations remain active |
| naive test-and-set | xchg on every probe |
exchanges again | every observation asks to write the lock |
| sleeping lock | ordinary loads, then xchg |
sleeps after eight reads | most observations stay read-only and most waiters leave the run queue |
| event lock on x86 | ordinary loads plus pause |
keeps spinning | fewer exchanges than naive test-and-set, but waiters remain active |
| POSIX and C23 mutexes | library fast path, then contended wait path | may enter the kernel | general parking and wake-up machinery dominates this one-increment body |
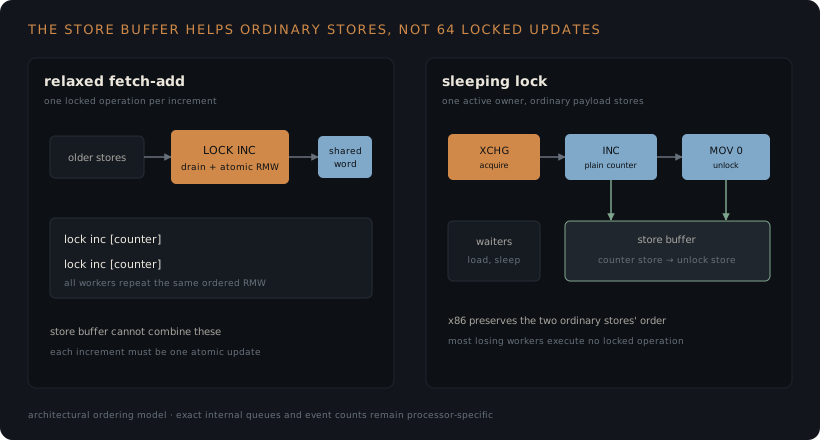
The store buffer explains part of the ranking, but these sessions did not collect store-buffer-full events or off-core ownership responses. Their result is therefore at the level of the complete loop, where locked-operation ordering, cache-line handoff, retry policy, and scheduling all interact. Assigning a measured share to each mechanism would require another run with processor-specific counters.
Backed-off CAS is useful here because it avoids the extra lock handoff. The winner updates the counter directly with one compare-exchange. Losers sleep. On Zen 5 that balance beat the sleeping lock. On Zen 4 and Intel, the plain increment behind one active lock holder won instead.
The naive lock shows why probing matters. Its xchg is implicitly locked on x86. Every losing waiter requests write ownership just to learn that the word still contains one. That traffic can interfere with the holder trying to write zero. The sleeping lock reproduction shows the exchange, read-only probes, and release store. The complete all-contender view includes naive test-and-set beside it.
Arm reverses the result
Neoverse V2 implements Arm's Large System Extensions. The measured binary and the LSE-enabled reproduction emit ldadd for the relaxed increment:
mov   x8, #1
ldadd x8, x8, [x0]
The C23 Arm reproduction contains the full function.
The sleeping lock replaces one direct atomic update with a handoff on a separate lock word, a plain payload update, and a release. On this Neoverse V2 system, the direct LSE ldadd is cheap enough under contention that those additional transitions cost more than the traffic the lock avoids.
The scaling curve is almost the opposite of Zen 4. On Zen 4, fetch-add moves from 1.98 nanoseconds with one worker to 6.70 with 64. The sleeping lock stays between 2.17 and 2.52. On Neoverse V2, fetch-add stays around seven to eight nanoseconds after the first worker. The sleeping lock rises from 8.53 to 9.08.
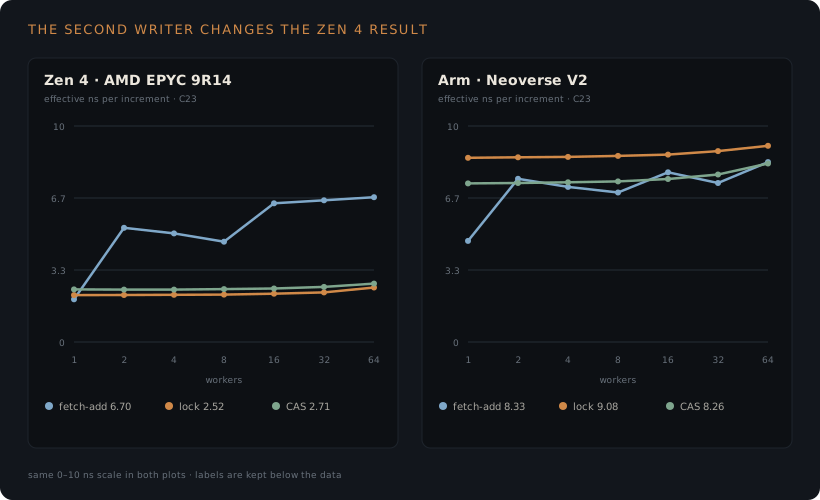
A separate Neoverse session measured fetch-add at 7.67 nanoseconds and the sleeping lock at 9.08, compared with 8.33 and 9.08 in the original run. Backed-off CAS moved from 8.26 to 8.19 while fetch-add moved ahead of it. The exact first-place row changed, but both sessions kept the direct atomic ahead of the lock and kept backed-off CAS within seven percent.
I therefore treat the Arm result as a direct-atomic win with backed-off CAS close behind. The Neoverse V2 technical reference manual documents LSE support, and the measured binary confirms that this processor executed the direct atomic instructions.
The consumer machines exposed the OS policy
The four-server table keeps one operating system, one language, and 64 explicit workers. I also ran the counter on my Linux desktop, an M5 Max, and a native Windows process to see whether the same ranking survived different schedulers, core layouts, compilers, and wait APIs.
Core Ultra 7 265 on Linux
The desktop has eight performance cores and twelve efficiency cores, but its topology detector incorrectly labeled all twenty as efficiency cores. I therefore use 16 explicit logical CPU IDs and report the placement as mixed instead of publishing separate P-core and E-core claims. Clang 18 compiled the C23 lane, and Linux remained under its recorded powersave governor.
| Core Ultra 7 265, 16 workers | effective ns per increment |
|---|---|
| sleeping lock | 5.63 ns |
| backed-off CAS | 6.27 ns |
| fetch-add | 20.93 ns |
| strong CAS | 77.27 ns |
| C23 mutex | 80.05 ns |
| POSIX mutex | 84.73 ns |
| weak CAS | 113.17 ns |
| event lock | 141.44 ns |
| naive test-and-set | 718.05 ns |
Despite the different core layout and worker count, the desktop preserves the server-side x86 ordering at the top of the table. The sleeping lock and backed-off CAS still beat fetch-add, so reducing the number of runnable waiters mattered more here than expressing the update as one atomic operation.
M5 Max on macOS
macOS offers quality-of-service requests rather than Linux-style hard affinity. With 18 workers requesting the performance placement, the C++20 lane produced:
| M5 Max, 18 workers | effective ns per increment |
|---|---|
| backed-off CAS | 2.17 ns |
| fetch-add | 5.74 ns |
| sleeping lock | 7.98 ns |
os_unfair_lock | 14.19 ns |
| C++ standard mutex | 24.59 ns |
| POSIX mutex | 24.71 ns |
| strong CAS | 26.58 ns |
| weak CAS | 26.58 ns |
| event lock | 92.70 ns |
| naive test-and-set | 172.04 ns |
I report the M5 separately because a quality-of-service request does not pin a thread and the scheduler may move workers between core types. Inside that session, backed-off CAS won by a large margin and fetch-add also beat the sleeping lock, reversing the order measured on the x86 Linux machines.
Core i9-13900KF on native Windows
The Windows measurement used eight native workers and MSVC under the normal scheduler. The placement request was not applied, and I measured one session.
| Core i9-13900KF, 8 workers, normal Windows scheduler | effective ns per increment |
|---|---|
| fetch-add | 8.22 ns |
| strong CAS | 14.43 ns |
| weak CAS | 14.93 ns |
| C++ standard mutex | 34.54 ns |
| event lock | 58.05 ns |
| backed-off CAS | 60.89 ns |
| sleeping lock | 62.37 ns |
| naive test-and-set | 91.60 ns |
The bad backoff result is still informative. Windows has no direct equivalent of a one-nanosecond nanosleep request in this implementation. The backoff calls SwitchToThread. It can hand the remaining slice to another ready thread, but it does not create the same wait used by the Linux and macOS implementations. A source-level contender named "sleeping lock" was therefore running a different OS policy. The reduced cross-platform wait source shows that difference.

The consumer result extract contains the medians, interquartile ranges, implementation lane, and worker count. The Windows numbers remain visible because they exposed a portability problem, but they stay out of the headline because their scheduler setup and repetition count differ from the server table.
The compiler can swap the atomic underneath you
The same source-level atomic can reach the processor in three materially different forms, depending on the Arm target and compiler policy.
A build targeting Armv8.1-A emits direct LSE operations:
ldadd x8, x8, [x0]A true Armv8-A baseline build without LSE uses a load-exclusive and store-exclusive loop:
.retry:
    ldxr  x8, [x0]
    add   x9, x8, #1
    stxr  w10, x9, [x0]
    cbnz  w10, .retry
Generic Linux builds often use a third form. GCC's -moutline-atomics emits a call to a helper such as __aarch64_ldadd8_relax. The helper checks at runtime whether the machine supports LSE, then selects the direct instruction or the exclusive loop.
That strategy lets one binary run on older Armv8-A systems and still use LSE on newer processors, but the helper adds dispatch code to a microbenchmark that is trying to compare the hardware operations themselves.
I therefore built the measured Arm rows for the processor and inspected the binary before running it. Compiler Explorer has the direct LSE ladder, GCC generic outlined ladder, and forced non-LSE Apple M1 target.
The same issue applies to exchange and compare-exchange. The LSE-enabled sleeping lock uses swpa on acquire and stlr on release. The strong CAS loop uses cas. A baseline target replaces them with exclusive loops or outlined helpers. The LSE lock, LSE strong CAS, and outlined strong CAS are separate reproductions because they are separate code. The saved Apple M5 assembly shows what Apple Clang emitted on the measured machine.
Inspecting the instructions invalidated two early Arm results. A generic build correctly reached LSE through a runtime helper even though its label said "untuned," while a build intended to force the baseline still emitted direct LSE because the driver accepted a flag without changing the selected Apple CPU. Both compiled without complaint, so the instruction listing was the only reliable answer.
Put useful work around the shared word
The counter test is intentionally severe. Real workers usually perform local work between shared operations.
I added a fixed five-second workload. Each thread runs a small integer payload, then touches the shared counter at a controlled ratio. The metric remains effective nanoseconds per local work item. The synchronization frequency ranges from one hundred shared increments per work item to one shared increment per ten thousand work items.
On Zen 4 with 64 workers and relaxed fetch-add:
| local work per shared increment | effective cost per work item |
|---|---|
| 0.01 | 677.256 ns |
| 0.1 | 68.711 ns |
| 1 | 14.792 ns |
| 10 | 0.813 ns |
| 100 | 0.345 ns |
| 1,000 | 0.035 ns |
| 10,000 | 0.017 ns |
At one hundred shared increments per work item, the isolated counter predicts about 670 nanoseconds of synchronization cost because each increment measured 6.70 nanoseconds. The separate workload measured 677.256, close enough to show that the counter still dominates this end of the sweep.
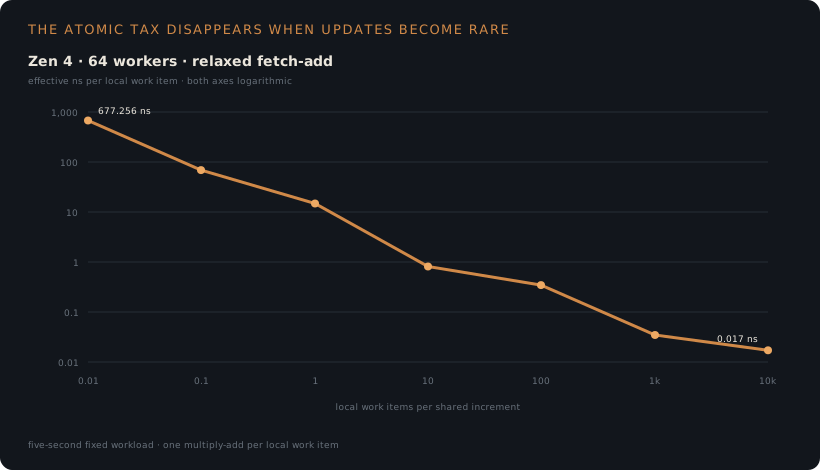
At one shared increment per ten thousand local work items, the synchronization cost is spread thin enough to nearly disappear from each item. Choosing a better primitive matters when updates are frequent, but changing the design so that updates are rare removes far more of the cost.
The processor generation changed the cost
Running two AMD generations produced another result I did not expect.
With one worker, relaxed fetch-add took 1.91 nanoseconds on Zen 4 and 4.46 on Zen 5 in C23. Rust measured 1.98 and 4.45. The newer processor was about 2.3 times slower on this uncontended atomic.
At 64 workers, the gap shrank. Zen 4 measured 6.70 nanoseconds and Zen 5 measured 7.91. The sleeping lock moved from 2.52 to 5.39. Backed-off CAS moved from 2.71 to 5.09 and became the winner.
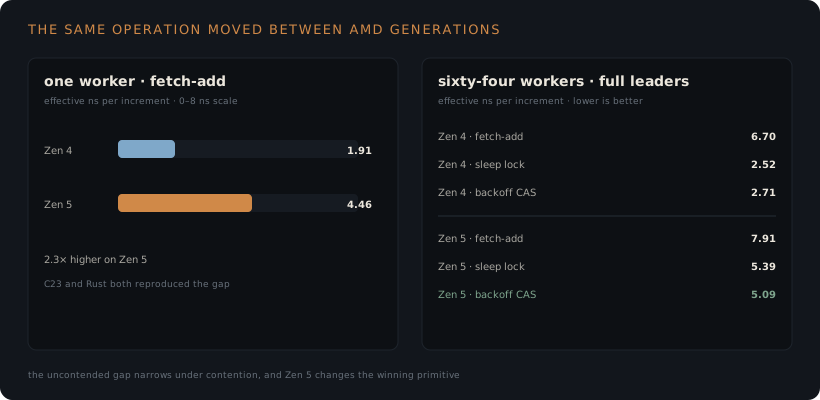
The source and operation were unchanged, yet the cost of the uncontended atomic more than doubled. That was enough to stop carrying a Zen 4 measurement into runtime decisions for Zen 5.
The measurements that nearly lied
The benchmark code ran in C23, C++20, and Rust. That caught problems, but only after I stopped treating a matching function name as proof of a matching workload.
Three payloads with one label
The first synchronization-tax comparison showed C++ far ahead of C. The C payload performed a shift, an XOR, a second bookkeeping update, and a runtime dispatch call. The C++ payload performed one inlined multiply-add.
Both rows were called integer.
The atomic instruction was identical. The surrounding work was not. I replaced the payloads with one pinned operation sequence and added instruction checks around the payload body. Every earlier cross-language tax number was discarded.
Fifteen percent from one load
The first clean Intel counter table still showed Rust about 15 percent behind C. Both lanes emitted lock inc.
The full loops explained it. C kept the counter address in a register and unrolled eight increments. Rust reloaded the pointer before every atomic because the counter lived behind an arena indirection the optimizer could not prove invariant.
The C loop looked like this:
.loop:
    lock inc qword ptr [r14]
    lock inc qword ptr [r14]
    lock inc qword ptr [r14]
    lock inc qword ptr [r14]
    ...
The Rust loop added one dependent load before every increment:
.loop:
    mov      rax, qword ptr [r15]
    lock inc qword ptr [rax]
    mov      rax, qword ptr [r15]
    lock inc qword ptr [rax]
    ...
The language did not make the atomic slower. An abstraction changed the loop. I passed the counter directly in every lane and the gap disappeared.
Sixty-four workers on eight processors
Two harnesses created 64 workers, but their default processor list contained only CPUs 0 through 7. Each processor ran eight benchmark threads while the C++ lane used the whole instance.
The results were stable. The interquartile ranges were small. They were also incomparable.
The runner now passes the full processor list explicitly. Each worker reads back its achieved affinity. The result records that list and fails when the requested and observed masks differ. The public table comes from the corrected placement.
A type that changed width
The first C lane used unsigned long. It is 64 bits on the Linux and macOS targets in this campaign and 32 bits on Windows.
That changed the atomic width. It also truncated a planted high bit in the maximum benchmark to zero, turning a rare-update workload into an always-update workload. The tests still ran. The counter still reached an expected value. They were proving a different program.
Every shared field and planted constant now uses an explicitly sized integer. I compared the emitted Linux instructions before and after the change to make sure the correction did not alter the already valid 64-bit rows.
A successful session with zero results
One platform wrote its result files to a path the collector never read. The validator received an empty set and returned success because it found no invalid records.
The session summary said passed. It had measured nothing.
The runner now fails when a benchmark produces zero records. A green result has to name the files it inspected.
Those failures changed the harness. It now uses one implementation lane, explicit placement, fixed-width types, and a hard failure when a session produces no records.
When the scheduler becomes part of the lock
The server table uses one worker per available logical processor. I also tested oversubscription and mixed-priority placement on the 18-core M5 Max.
At 36 workers, the naive test-and-set lock became unusable. A low-priority thread could be descheduled while holding the lock. Higher-priority waiters stayed runnable and kept the cores busy spinning, which prevented the holder from running.
The same failure appeared at a phase barrier. Arrived workers spun while the last low-priority participant waited for a core. The waiters were occupying the processors needed to finish the wait.
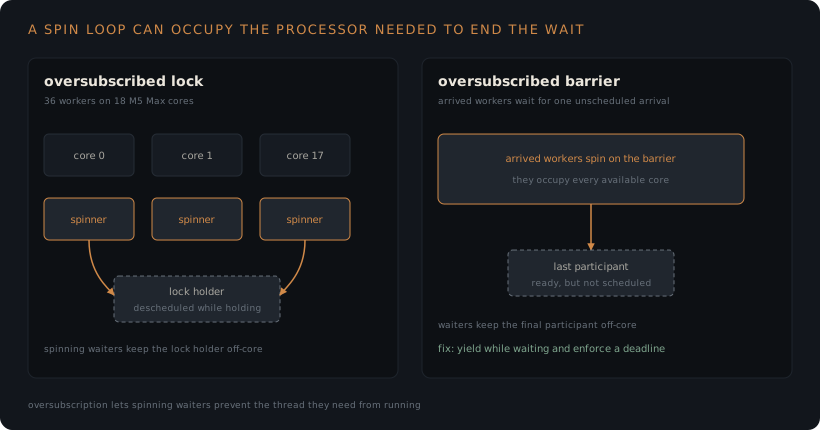
I changed the harness before collecting more data. Barriers now yield, every cross-thread wait polls a deadline, and a cell that completes no repetitions emits no record.
Once the machine is oversubscribed, I only use this lock where a thread is expected to keep running while it holds the word. If the holder may block or remain descheduled long enough to starve its waiters, I use an operating-system mutex.
Reproducing the instruction claims
The public source and Compiler Explorer links are split by question:
| question | x86-64 | Arm LSE | generic or baseline Arm |
|---|---|---|---|
| all six custom contenders | GCC 16 + Clang 21 matrix | same matrix | same matrix |
| relaxed fetch-add | lock inc |
ldadd |
outlined ldadd |
| strong compare-exchange | lock cmpxchg |
cas |
outlined CAS |
| sleeping lock | xchg, loads, store |
swpa, loads, stlr |
outlined exchange |
| event lock | pause |
wfe, sev |
outlined exchange plus event wait |
| ordering ladder | x86 locked forms | LSE ordering suffixes | forced non-LSE Apple M1 loops |
The mutex rows do not have useful standalone Compiler Explorer links because their call sites only show a library call and the contended implementation lives in the selected C library or operating-system runtime. Compiler Explorer supports the emitted-instruction claims for the custom contenders, while the timings still come from the machines named in the tables.
The CSV files contain the medians and interquartile ranges, while the links above expose the code and emitted instructions. Within each Linux machine, every contender used the same processor list and power policy.
What I shipped in Astral
I removed Astral's event lock and replaced it across the runtime with one BackoffSpinLock. The old lock waited with pause on x86 and WFE on Arm, then issued SEV on every Arm unlock.
In the 64-worker counter test it took 179.19 to 262.92 nanoseconds across the three x86 servers and 159.83 nanoseconds on Neoverse V2. The nanosleep lock took 2.52 to 8.54 nanoseconds on x86 and 9.08 on Neoverse V2, making the old event-lock algorithm between 18 and 71 times slower in this isolated handoff.
Astral does not use the one-nanosecond nanosleep request from the headline result. After its first failed exchange, the shipped lock checks the word with ordinary loads, doubles its pause count up to 1,024, and then yields. That fits Astral's mix of short internal critical sections without keeping the broadcast wakeup that made the old event lock lose.
Compare-exchange now backs off after failure. It stayed within 16 percent of the best C23 result on all four servers in the original sessions, won outright on Zen 5, and remained close on Neoverse V2 after the repeat moved fetch-add into first place.
The shared word is still the first thing I try to remove. If it has to remain, I compile the exact loop for the target processor and rerun this counter test there: the x86 servers rewarded putting most losers to sleep, while Neoverse V2 rewarded the direct atomic.